Real Time Gas Monitoring
- Sector
- IoT & Dashboards
- My role
- Frontend Developer
- Year
- —
- Status
- Live — visit ↗
01 — Problem
The problem
Gas distributors needed a reliable way to get real, up-to-date readings from the gas stations through to their various distribution channels. Without live visibility, volumes consumed and distributed across facilities had to be reconciled after the fact, leaving operators blind to what was actually happening on the ground in real time.
02 — What I did
What I did
I led the frontend, building the dashboard that surfaces live station data and turning the raw IoT/WebSocket stream into readable, monitorable views and reports for operators.
03 — The hard part
Live sensor readings arrive continuously over WebSocket, so the challenge was rendering them into ChartJS without the UI stuttering as new points streamed in. I kept the socket layer decoupled from the charts and fed updates through Redux Toolkit Query so the visualizations stayed smooth under a constant flow of data.
04 — Result
The result
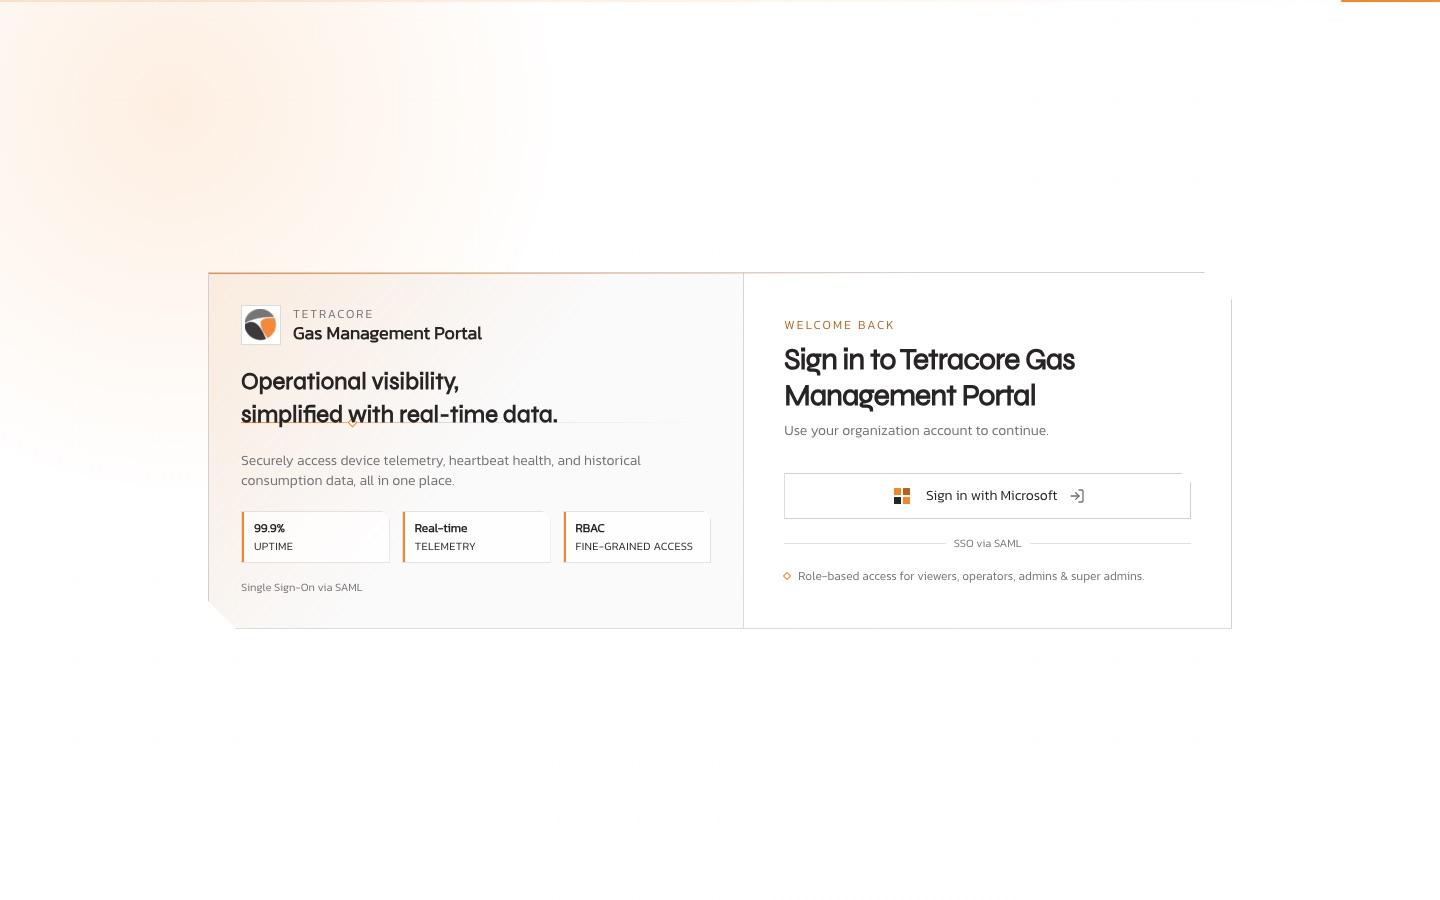
The platform is live at web.tetracorehub.com, giving operators a single dashboard to monitor gas volumes across facilities in real time and generate reports from the same data.
For engineers: stack
NextJS, TS, Redux Toolkit Query, TailwindCSS, Shadcn UI, IOT, WebSocket, ChartJS, Microsoft SAML
Need something similar?
Let's talk →